The game · Numbers
Dice odds calculator: every win chance, multiplier and target
One formula links the win chance, the multiplier and the house edge on every crypto dice game. Here it is worked out for 26 targets, with the roll under and roll over lines and the odds of losing five rolls in a row.
Every crypto dice game runs on the same arithmetic, so one dice odds calculator covers all of them. Below is the formula, a full table for the targets people actually use, and how to read any dice screen in reverse to find the edge it charges.
The formula
Three numbers describe any dice bet: the win chance (in %), the multiplier (what a win pays, stake included) and the house edge (in %). They are linked by:
multiplier = (100 − house edge) ÷ win chance
and, rearranged,
house edge = 100 − win chance × multiplier
Two quick checks:
- 25% chance, 1% edge: 99 ÷ 25 = 3.96×.
- A game shows 50% at 1.96×: 100 − 50 × 1.96 = 2% edge.
The dice odds table
Roll under uses the target as shown; roll over uses 100 minus the chance. The last column is the chance of losing five rolls in a row at that win chance, the number most players underestimate.
| Win chance | Multiplier (1% edge) | Multiplier (2% edge) | Roll under | Roll over | 5 losses in a row |
|---|---|---|---|---|---|
| 0.01% | 9,900.00× | 9,800.00× | 0.01 | 99.99 | 99.95% |
| 0.1% | 990.00× | 980.00× | 0.10 | 99.90 | 99.5% |
| 0.5% | 198.00× | 196.00× | 0.50 | 99.50 | 97.5% |
| 1% | 99.00× | 98.00× | 1.00 | 99.00 | 95.1% |
| 2% | 49.50× | 49.00× | 2.00 | 98.00 | 90.4% |
| 5% | 19.80× | 19.60× | 5.00 | 95.00 | 77.4% |
| 10% | 9.9000× | 9.8000× | 10.00 | 90.00 | 59.0% |
| 15% | 6.6000× | 6.5333× | 15.00 | 85.00 | 44.4% |
| 20% | 4.9500× | 4.9000× | 20.00 | 80.00 | 32.8% |
| 25% | 3.9600× | 3.9200× | 25.00 | 75.00 | 23.7% |
| 30% | 3.3000× | 3.2667× | 30.00 | 70.00 | 16.8% |
| 33% | 3.0000× | 2.9697× | 33.00 | 67.00 | 13.5% |
| 40% | 2.4750× | 2.4500× | 40.00 | 60.00 | 7.8% |
| 45% | 2.2000× | 2.1778× | 45.00 | 55.00 | 5.0% |
| 49.5% | 2.0000× | 1.9798× | 49.50 | 50.50 | 3.3% |
| 50% | 1.9800× | 1.9600× | 50.00 | 50.00 | 3.1% |
| 55% | 1.8000× | 1.7818× | 55.00 | 45.00 | 1.8% |
| 60% | 1.6500× | 1.6333× | 60.00 | 40.00 | 1.0% |
| 66% | 1.5000× | 1.4848× | 66.00 | 34.00 | 0.454% |
| 70% | 1.4143× | 1.4000× | 70.00 | 30.00 | 0.243% |
| 75% | 1.3200× | 1.3067× | 75.00 | 25.00 | 0.098% |
| 80% | 1.2375× | 1.2250× | 80.00 | 20.00 | 0.032% |
| 85% | 1.1647× | 1.1529× | 85.00 | 15.00 | 0.008% |
| 90% | 1.1000× | 1.0889× | 90.00 | 10.00 | 0.001% |
| 95% | 1.0421× | 1.0316× | 95.00 | 5.00 | under 0.001% |
| 98% | 1.0102× | 1.0000× | 98.00 | 2.00 | under 0.001% |
Two things stand out. First, the difference between a 1% and a 2% edge looks tiny per row and doubles the long-run cost of play. Second, at low win chances a string of five losses is not a bad run; it is the normal case.
Reading a dice screen in reverse
You rarely need to trust a game's own claim about its edge. Take any target from the screen and multiply the win chance by the multiplier:
| Game shows | Chance × multiplier | Edge |
|---|---|---|
| 50% → 1.98× | 99.0 | 1% |
| 50% → 1.96× | 98.0 | 2% |
| 33% → 2.97× | 98.0 | 2% |
| 10% → 9.90× | 99.0 | 1% |
If the result is 99, the edge is 1%. If it is 98, the edge is 2%. Anything lower means you are paying more for the same game. The in-house dice on the sites in our crypto dice games ranking typically show 99, but check the game you play, because settings can differ by site and by product.
Expected cost of a session
The edge applies to every unit you wager, so the expected cost of a session is simply:
expected cost = total wagered × house edge
| Stake per roll | Rolls | Total wagered | Expected cost at 1% | at 2% |
|---|---|---|---|---|
| 0.10 USDT | 1,000 | 100 USDT | 1 USDT | 2 USDT |
| 1 USDT | 500 | 500 USDT | 5 USDT | 10 USDT |
| 5 USDT | 300 | 1,500 USDT | 15 USDT | 30 USDT |
| 20 USDT | 200 | 4,000 USDT | 40 USDT | 80 USDT |
This is the average. Any single session can end far above or below it; the table tells you what the game charges you for the ride, not where the ride ends.
Losing streaks at common targets
Players pick targets by how often they win. They should also look at how often they lose several times in a row, because that is what empties a balance under a doubling system.
| Win chance | 5 losses in a row | 10 losses in a row | 1 in … for 10 losses |
|---|---|---|---|
| 90% | 0.001% | 0.00000001% | 10,000,000,000 |
| 66% | 0.454% | 0.00206% | about 48,500 |
| 49.5% | 3.3% | 0.108% | about 927 |
| 33% | 13.5% | 1.82% | about 55 |
| 10% | 59.0% | 34.9% | about 3 |
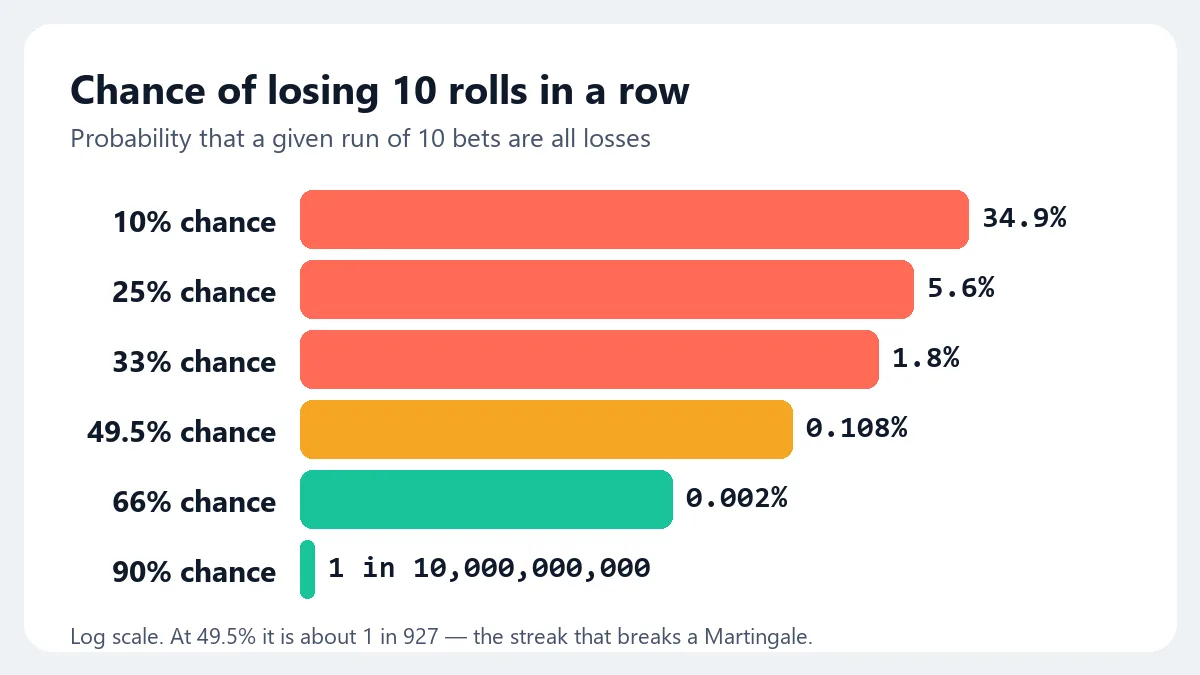
At 49.5%, a ten-loss streak comes about once every 927 starting points. Over a thousand rolls, the chance of meeting at least one is about 2 in 5; over three thousand rolls, about 4 in 5. That single fact is the reason the crypto dice strategy page spends so long on Martingale.

Where to use this
- Before a session, pick the win chance whose losing streaks you are comfortable with, not just the payout you like.
- Before a bonus, work out how much you will wager to clear it and multiply by the edge to see the expected cost.
- Before trusting a new site, reverse-check the multiplier at two targets. If both give 99, the edge is 1%.
The mechanics behind every number here are explained in how crypto dice works, and the way to prove individual rolls were honest is in provably fair dice.
Numbers do not make it safe
A calculator makes dice look controllable, and in one sense it is: you know the price of every bet. What it cannot do is make a loss affordable. Decide what you will wager before you start and stop when you get there. Gambling is for adults over 18; free, confidential help is available from Gamblers Anonymous and GamCare.